Visualizing techniques with plants (old)
My old blog post about visualizing data with plants was a summary of related artworks. But for my master thesis, I had to apply a theoretical analysis method. The result is supposed to be a more (scientific) valuable evaluation of visualization techniques with plants. Here is the first version of it.
Nowadays information becomes more pervasive and crucial in a knowledge-based society [1]. Therefore it is important for a society to develop an easy access to communicate meaning and functionality of information [2]. The easiest information access exists in our natural everyday physical environment. Public Screens attempt to address this task. Unfortunately, current public screens hold several disadvantages for our public environment. They need a dedicated flat surface, illuminating their surrounded environments, and address only the visual sense. Furthermore, people often associate public screens with advertisement and pay less attention to them [2]. Therefore, it is rational to investigate information displays beyond the traditional screen-based visualizations. Plants are one of these objects, which are omnipresent in our daily physical environment. For this reason, data sculptures with plants might be an alternative approach to solve the problems of public screens and reach wide audiences.
Within the scope of my research I will present a qualitative evaluation of visualizing techniques with plants. The evaluation model is based on the comparison methods developed by Andrew Vande Moere, Dietmar Offenhuber [2], Matthew Brehmer, and Tamara Munzner [3]. The evaluation result reveals their visual encoding techniques, and which characteristic of data they visualize. Furthermore, the outcome assigns approaches of creating more intriguing, and easy memorable visualizations.
First we will explore a short introduction in contemporary plant-based artworks which do not primary visualize information or a narrative. They reveal a contemporary design vocabulary of plant-based artworks. After the introduction we will compare various visualization techniques.
Contemporary Fine Art without technology
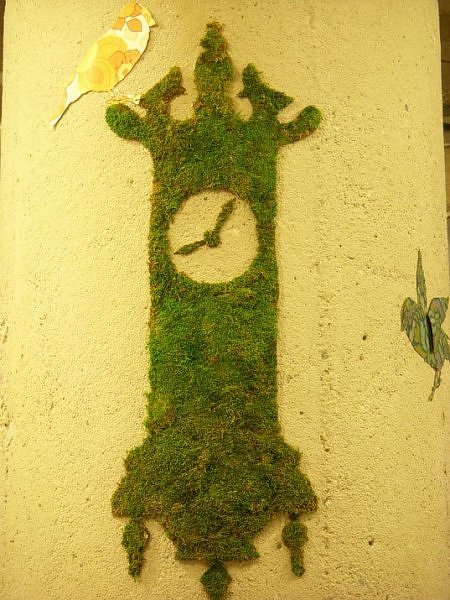
The leaf is very basic piece of our natural ecosystem. Plenty of them exist in different shapes and materials. Lorenzo Manuel Durán is a master of using them in a stencil oriented approach. He creates amazing pictures inside the shape of a leaf (Works: Chapter 2 | 3 | 5 | 6 | 7 | 8). Furthermore, Anna Garforth uses leaves for mid-sized Typography installation, like "Rethink". Despite, leaves are a flexible and ever-present resource. Anna Garforth shifted her approach of working with leaves to moss (Grow | Big Bang). Moss is very practical material, which is able to live on walls and easy to shape. The Design Studio Mosstika provides us evidences that moss installations fit perfectly in urban environments. Besides of moss, the Vertical Garden approach is used more frequently by architects nowadays. They create green walls for a more nature-oriented experience of buildings. Furthermore, they utilize the cooling effect of the plants to decrease the building's temperature. Engineers, Designers, and the DIY community (video) have already discovered the Vertical Garden for their own applications.
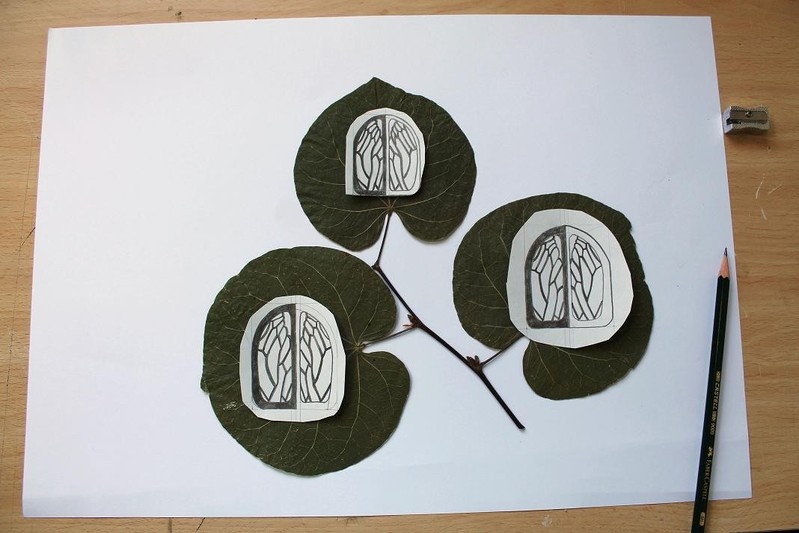
Leaf Art by Lorenzo Manuel Durán - Work in progress
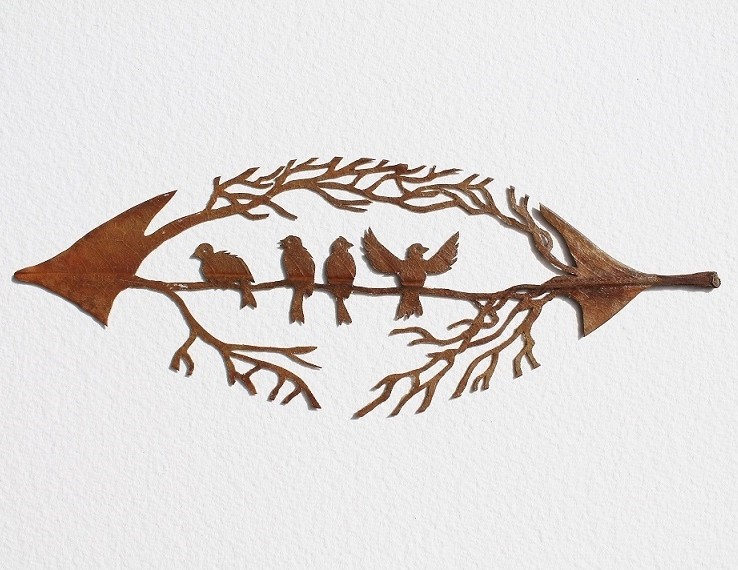
Leaf Art: Lorenzo Manuel Durán - "PÁJAROS"

Anna Garforth - Rethink - Typography installation with leafs
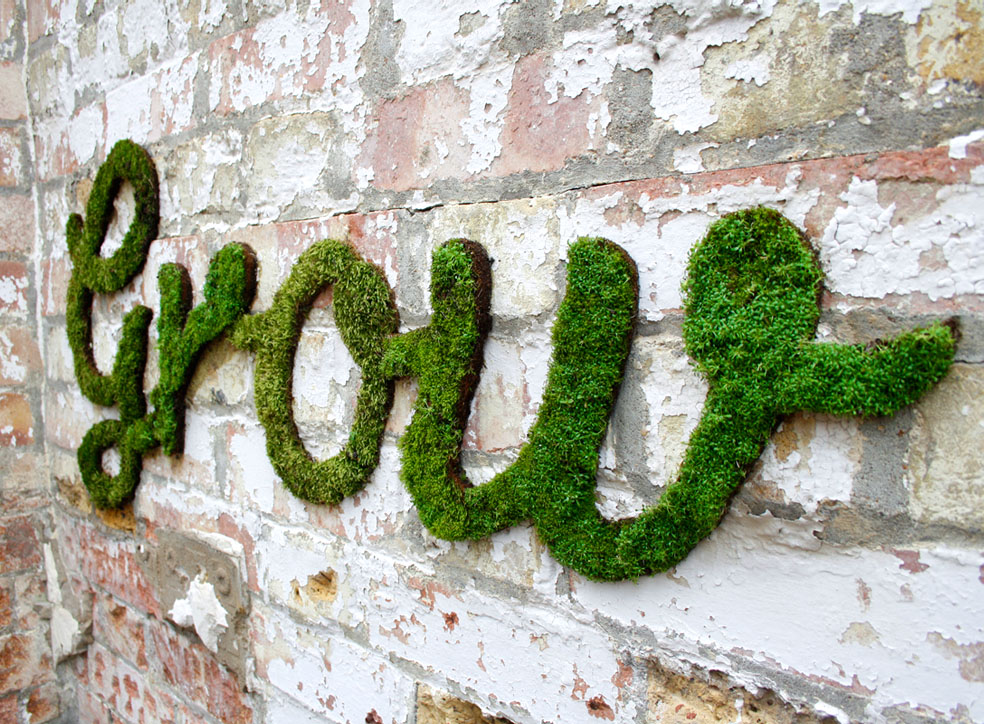
Anna Garforth - Grow - Typography installation with moss
Moss Art in an urban environment- Photo by Inhabitat (Flickr)
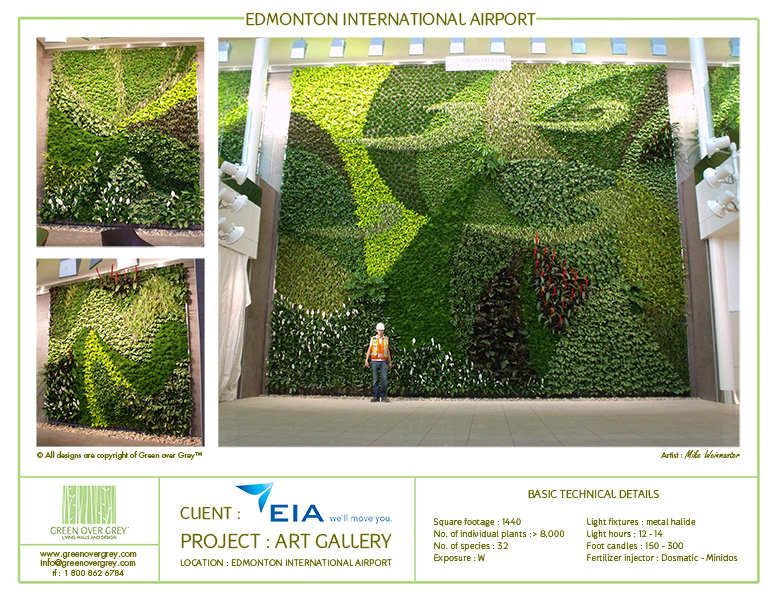
Green Wall - Edmonton Int. Airport Location: Edmonton, Alberta
Aside from that small to mid-size to huge 2D surface approaches, the sculpture and installation domain deals with spatial approaches. Especially, Azuma Makoto is very well known for his Plant Sculptures. One of his masterpieces "Collapsible leaves" is a great example of plant-based sculptures in the domain of interior design. In relation to environmental design, the Montreal Mosaiculture Exhibition (book) presents an extraordinary collection of mid-size to huge plant sculptures.
In association with installations and narratives a "Plant Display" is also an encouraging approach. A Plant Display (instructions) combines a collection of plants in a specific arrangement. It is very similar to the Japanese tradition Ikebana, which involves the narrative aspects of plant arrangement. Moreover, plants can be used for creating fictional subspaces, like Banksy recently did in New York (article | video). In the following we call this kind of subspaces inside a natural, urban, or interior environment, Plant Installations. Plant Installations are usually bigger than sculptures and they bridge the gap between Gardening (see example 1 | 2) and Land Art / Landscape Architecture.
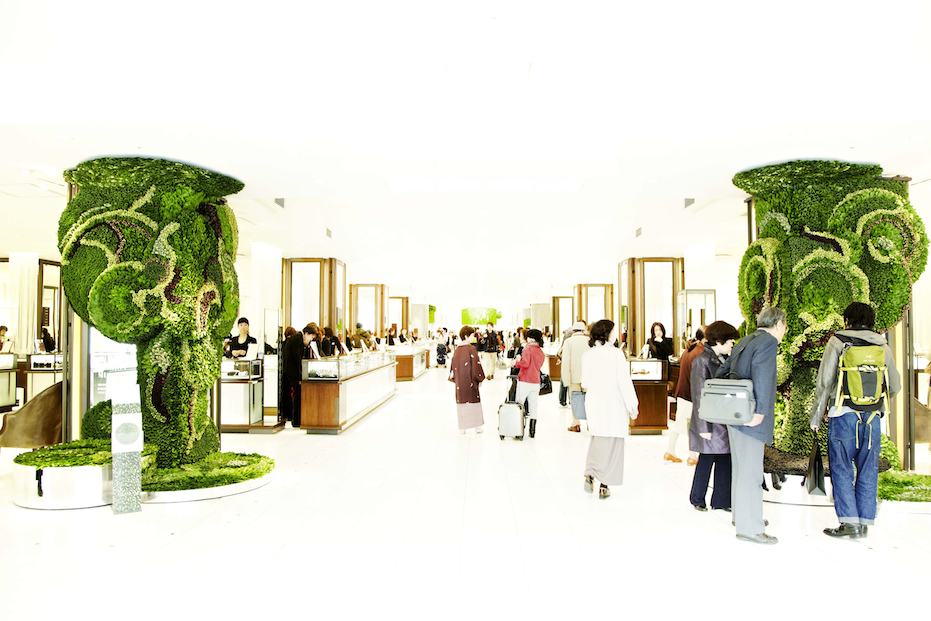
Collapsible leaves for Isetan Shinjuku grand opening

Plant Sculptures at the Montreal Mosaiculture Exhibition

Banksy - All City - Plant Display installation in New York
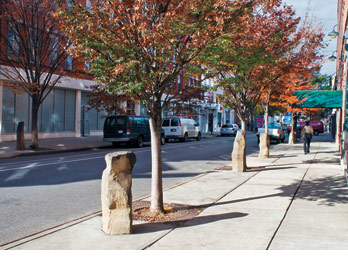
Land Art can exist anywhere in the open air. The size of the artworks ranges from mid-size to very large installations. For instance, the artwork 7,000 oaks by Joseph Beuys is installed through the entire city Kassel, Germany. The very well-known Crop circles are in a size of a crop field. The real beauty of these artworks can be mostly perceived from air or other tall objects. The artwork "Trümmerflora" by Harrison had its place on an abandoned area in Berlin. The artworks by Nils-Udo are very often located in a forest or other natural environments (e.g. parks). He combines sculpture and environmental design approaches in one artwork. Land Art is a comprehensive topic by itself and a more in-depth research is beyond the scope of this research. At least, the artistic practices of Land Art provide us an impression, how Art and Design objects can be harmonically integrated into a natural environment.
Joseph Beuys, 7000 Oaks, Environmental Art
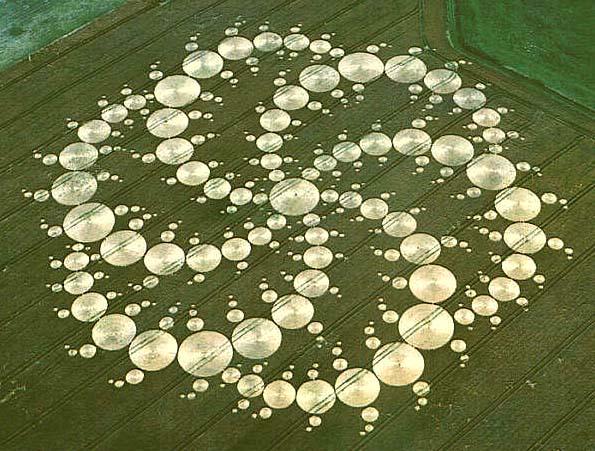
Large Scale Canvas: Crop circles - Source: Wikipedia
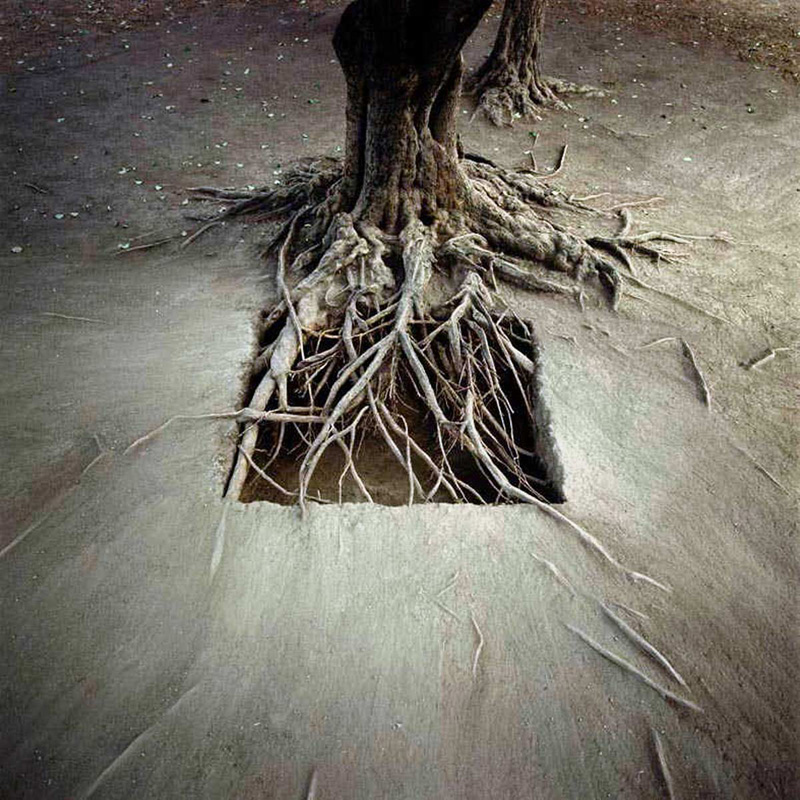
Nils Udo - Tree Roots - Land Art Installation and Natural Artifacts
In summary, the mentioned art approaches hold narrative and aesthetic aspects. They imagine a design vocabulary and develop a comprehensive knowledge about craftsmanship with plants. Additionally, all these artworks belong to the domain of Living Sculptures. They have fading character and inhere a very sensitive life cycle. For this reason, time has a larger influence on these artworks than on other artworks and is an important conceptual aspect.
Methodology of the qualitative evaluation
The objective of this qualitative research is a precise comparison of plant-based visualization tools across their application domain. The analysis model is a combination of the "Multilevel Typology of Abstract Visualization"[3] by Matthew Brehmer and Tamara Munzner and the "Contextual Taxonomy of Alternative Information Display"[2] by Andrew Vande Moere, Andrew and Dietmar Offenhuber.
The first iteration of the analysis clusters the artworks in their environmental context [2]. After the clustering iteration, the question of the used visualization methods "Visualization as Translation without context", "Visualization as Augmentation within context", and "Visualization as Embodiment" will be answered.
Table: evaluation template of visualizations with plants
The second iteration investigates each cluster on its data and task oriented attributes. The analysis method is derived from the classification methodology of Matthew Brehmer and Tamara Munzner [3]. In our case the qualitative evaluation template includes all their topologies "why", "how" and "what". The topology "why" explores the story of the visual content and its intention for the user. Furthermore, it examines if the visualized information is searchable. The task analysis of query, filter, aggregate and derive are excluded from my definition of the topology "what". These tasks are too much related to screen-based visualization. It will not be possible to perform these tasks within a visualization technique with plants. . The topology "how" involves an evaluation of interactive and data input tasks. The topology "what" determines the character of data (e.g. categorical, ordinal, quantitative, and so on). A more detailed explanation of the evaluation components is available in table 1 above.
The cluster of marker approach
This cluster contains only the art project LEAF++, which is an interactive infoscape based on leaves. Their mobile application detects the shape and structure of a leaf (Visualization as Embodiment) and assigns a unique marker ID. This marker can be linked with any digital data, as we know it from its well-known counterparts Barcode and QR-Code. The feature of a digital attachment to a physical object fulfils the requirements of augmented reality. It can be applied in any urban and natural environment. For this reason, the linked data can be browsed, explored and edited between people within its local context.
The cluster of plant displays
The cluster of plant displays counts 15 visualization projects. That is the biggest collection within a cluster. Every project visualizes a story or data in the form of a plant. The plant becomes a data sculpture by itself. Hence, all projects hold the characteristic of Visualization as Embodiment. The visualized data is translated in plant growth, plants health, and plants movement.

Dialog, a human - plant installation by Terike Haapoja

Information visualization project: The Garden of Eden

Plant Display by Satoshi Kuribayashi and Akira Wakita
Hydroponic sculpture: Juggernaut by Phil Ross
Installation: Junior Return by Phil Ross
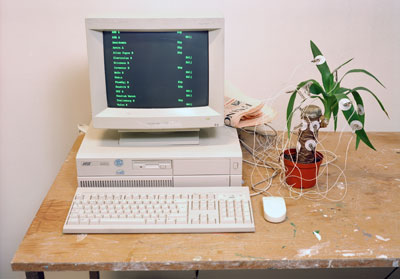
Yucca Invest Trading Plant by Ola Pehrson
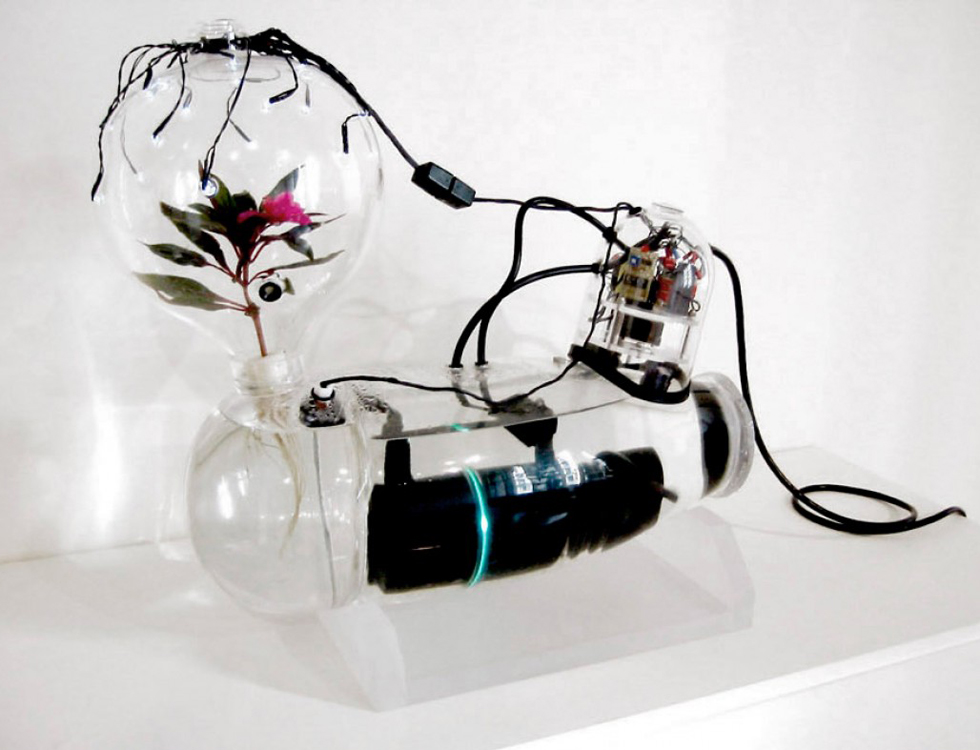
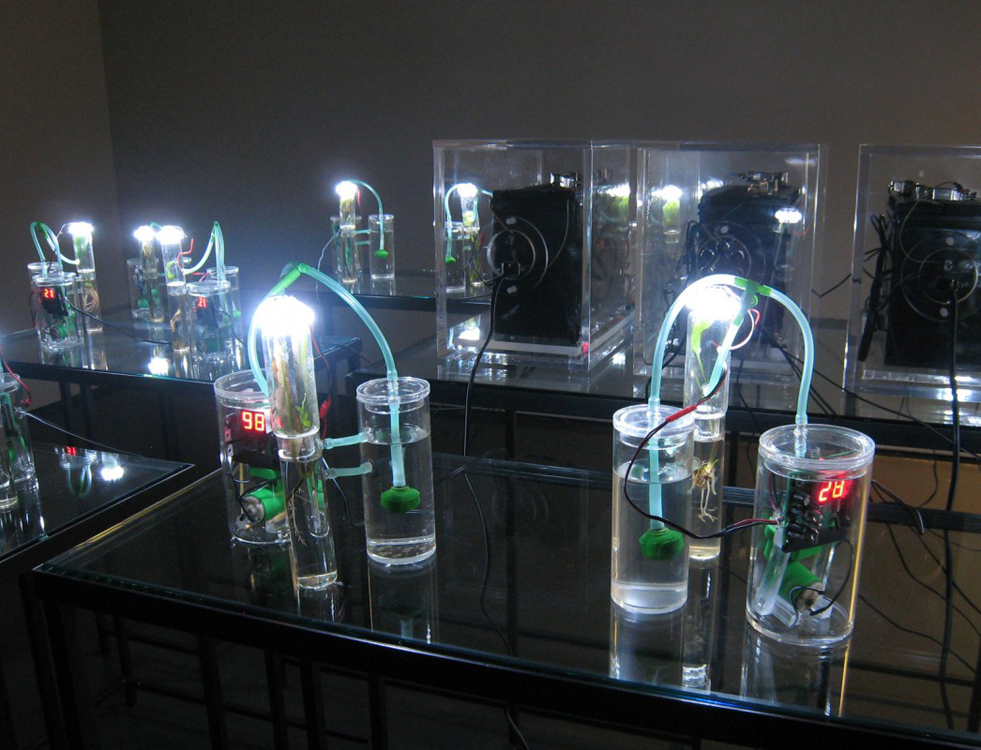
The visualizations, which utilize plant growth and plant health, involve the recording task. The recorded data has always a time-based dimension. The time-based data is mostly connected with other quantitative data. The sources of this quantitative data are very diverse. It can be motion data, stock prices[9], human communication behaviour[6], or environmental data like air pollution[11] or the humidity of soil. The values are translated to the plants ecosystem. The plant's ecosystem is influenced by watering, light, air (e.. gas supply[11], fan), and heat. Some projects (PlantDisplay[6], Juggernaut, Jarred-In, Junior's Return) use a hydroponic approach for an accurate control of nutrient supply. The hydroponic projects and others use (Yucca Trading Plant, Dialog, Infotropism[4] ) light additionally. The artworks Anatomy of a Landscape and Paludarium SUGURU run complete closed ecosystem. The data influenced ecosystems express the development of data in the plant's growth and health. None of these artworks are really augmented in their natural environment. Especially, the projects with a controlled lightning system or closed ecosystem need a room without natural light conditions.
In contrast of the above mentioned projects, the visualizations (Flona [10], Tsunagari kan - Family Plant[7,8], The Mediated Body of Plants) without the recording task apply a visualization as augmentation in their natural environment. Their visual encoding is realized through plant's movement (kinetic gestures). The performed kinetic gestures are rotating, waving, shuddering, or the movement of certain branches. The data attributes of these visualizations are mostly an information about a current state, like motion data (human presence) [7,8,10] or too less water.
Cluster of projection mapping
Projection Mapping are well-known as a visualization technique on architectures (media facades). Artists projected stunning animations on a building's facade. The elements of the facade are mostly involved the design of the animation. The results are new spatial experiences of an environment. The artists Clement Briend, Craig Walsh and studio Apparati Effimeri made the effort to apply projection mapping to a natural environment. The projection mapping projects "Cambodian Trees (video) and "Spacemakers" involved trees in a public environment. Their visual content (static images) is influenced by the local cultural history. In addition their projects, the studio Apparati Effimeri applied animation to their projection mapping on a tree. The projected animated leaves have a fluent transition to the real physical leaves. These projected leaves can be hardly distinguished from the real ones. The result is a new spatial experience of the physical tree. In addition to that, projection mappings on branches exist, too. Apparati Effimeri's projection mapping Incanto Mutevole used several trees and their branches to tell their visual story. The introduced projection mappings are totally augmented in their environment. The arrangement of the visual content is based on the shape and size of the tress. For this reason, each of this visualization is an embodied visualization.
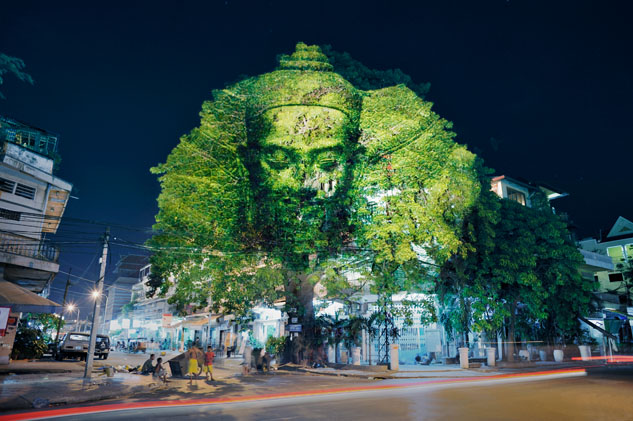
Cambodian Trees by Clement Briend
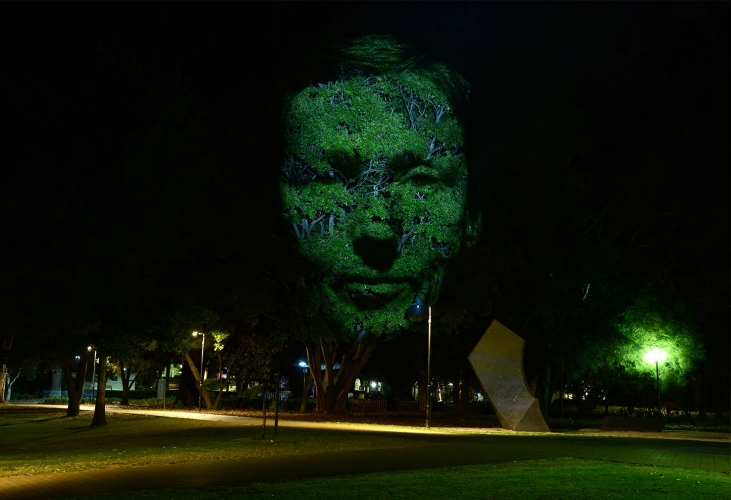
Spacemakers by Craig Walsh
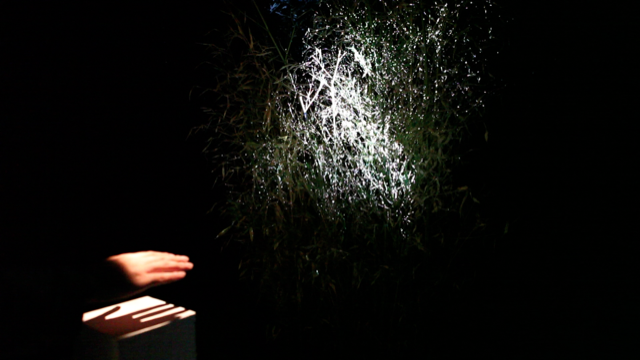
Lit Tree by Kimchi And Chips
The projection mapping "Lit tree" is not augmented in a public environment, but it enables projection mapping on a plant in an exhibition context. Moreover, the project enhances the visual experience with an interactive component. The visitors can move their hands within a motion sensitive area. The motion data will be visualized as 3D pixel on a bush. The most frequented areas provide more light than their less frequented counterparts. The plant grows better in the more illuminated locations. In that context, the history of the motion data is stored and visualized in the plant's growth. This additional visualization feature can be assigned as a method of translation.
Cluster of printing approach

Allison Kudla's Bumbershoot Version
Organograph - A Climate Clock
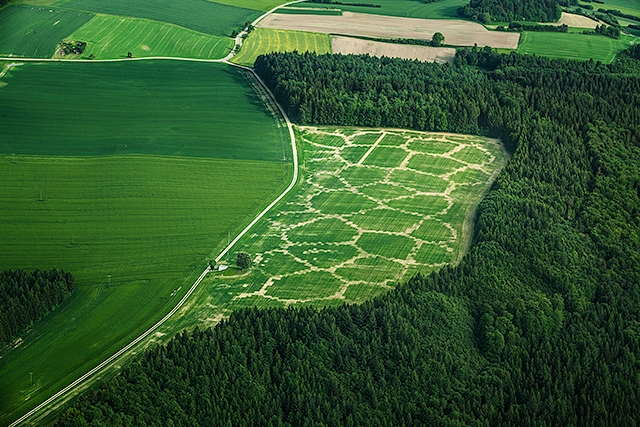
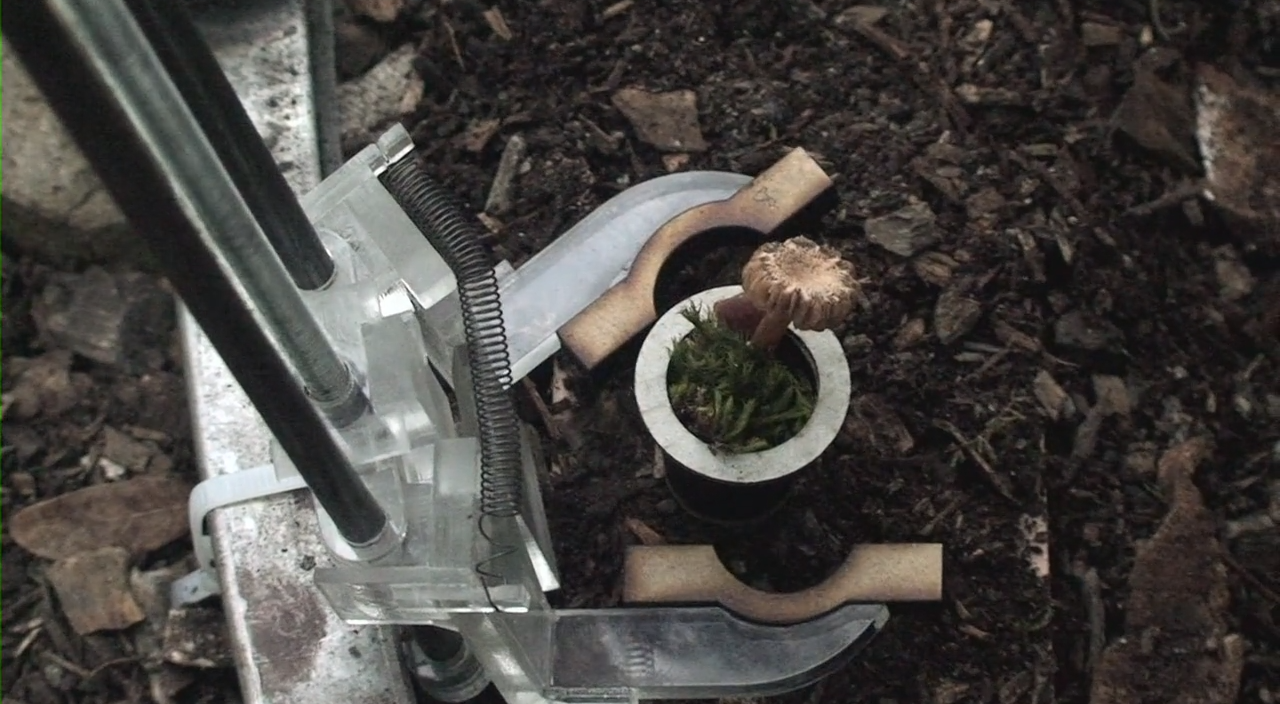
Argrar Printing: "The Avena + Test Bed"
The printing approach visualizes data through a predefined arrangement of seeds or plants. The print sizes ranges from table size to the size of a field. Allison Kudla's "Capacity for (urban eden, human error) Bumbershoot Version" and Benedikt Groß's "Avena+ Test Bed"(article) arrange seeds depending on algorithm generated visual pattern. Their visual outputs are graph-specific objects. The representation of nodes and paths belong to these visual outputs. The project Organograph uses bedding plants instead of seeds. All three projects translate their data in a 2d coordinates system. The "Organograph" and the "Avena+Test Bed" are seamless integrated in their environment. For instance, the Organograph is involved as a sculpture inside a park. Its visualization output beautifies a path of the park in an educational context. The "Avena + Test Bed" still meets the requirements of an ordinary field. The only exception is the bigger variation of plants within the field. The higher biodiversity of the field is the artists call for more biodiversity in current Agriculture. These two projects are definitely augmented visualizations.
In contrast to that, Allison Kudla's artwork is not augmented. Her print approach uses the technology of a CNC machine. The machine runs in an exhibition space. Additionally to the printing approach, her artwork "Capacity for (urban eden, human error) Bumbershoot Version" uses the feature of plant's growth. The plant's growth emphasizes her visualizations of networks and clusters. All three visualization embody their input data.
Results of the evaluation
All of the introduced visualization techniques have an embodied context. Particularly, the translation of quantitative data to plant's growth and health emphasizes the visualization as embodiment. Most of the mentioned projects provide the approach of visualization as augmentation. For this reason, plant based visualization is an appropriate tool for information visualization in an urban and natural environment.
The complexity of visualized data is low in most of the projects. For instance, the plant displays represent usually one or two data values. The changes of data values do not appear immediately. It takes some time until the changes become visible by plant's growth. For this reason, the visualization with plants is suited for mid to long term data visualizations.
If the precision of visualization must be higher, the projection mapping or printing approach might be a suitable solution. Especially, the projection mapping approach offers a big scope of play. Furthermore, none of the Plant Displays projects involve certain life cycles (e.g. blossom) of a plant yet. This certain life cycles could be utilized for visualizing more complex data. In this relation, visualization with plants provides an interesting scope for an on-going research.
The evaluation reveals that rich, more accessible and more emotional visualizations for our everyday environment can be established with plants.
Appendix:
Papers:
- [1] Jack Zhao and Andrew Vande Moere. 2008. Embodiment in data sculpture: a model of the physical visualization of information. In Proceedings of the 3rd international conference on Digital Interactive Media in Entertainment and Arts (DIMEA '08). ACM, New York, NY, USA, 343-350.
- [2] Vande Moere, Andrew, Offenhuber, Dietmar. 2009. Beyond Ambient Display: A Contextual Taxonomy of Alternative Information Display. In International Journal of Ambient Computing and Intelligence, IJACI 1(2), p. 39-46.
- [3] Brehmer, Matthew and Munzner, Tamara. A Multi-Level Typology of Abstract Visualization Tasks. IEEE Transactions on Visualization and Computer Graphics (TVCG), 19(12), p. 2376-2385.
- [4] David Holstius, John Kembel, Amy Hurst, Peng-Hui Wan, and Jodi Forlizzi. 2004. Infotropism: living and robotic plants as interactive displays. In Proceedings of the 5th conference on Designing interactive systems: processes, practices, methods, and techniques (DIS '04). ACM, New York, NY, USA, 215-221.
- [5] Satoshi Kuribayashi, Yusuke Sakamoto, and Hiroya Tanaka. 2007. I/O plant: a tool kit for designing augmented human-plant interactions. In CHI '07 Extended Abstracts on Human Factors in Computing Systems (CHI EA '07). ACM, New York, NY, USA, 2537-2542.
- [6] Satoshi Kuribayashi and Akira Wakita. 2006. PlantDisplay: turning houseplants into ambient display. In Proceedings of the 2006 ACM SIGCHI international conference on Advances in computer entertainment technology (ACE '06). ACM, New York, NY, USA, , Article 40.
- [7] Miyajima, A., Itoh, Y., Itoh, M. & Watanabe, T."Tsunagari-kan" Communication: Design of a New Telecommunication Environment and a Field Test with Family Members Living Apart. In International Journal of Human-Computer Interaction, 2005, 19, 253-276
- [8] Yoshihiro Itoh, Asami Miyajima, and Takumi Watanabe. 2002. 'TSUNAGARI' communication: fostering a feeling of connection between family members. In CHI '02 Extended Abstracts on Human Factors in Computing Systems (CHI EA '02). ACM, New York, NY, USA, 810-811.
- [9] Douglas Easterly. 2004. Bio-Fi: inverse biotelemetry projects. In Proceedings of the 12th annual ACM international conference on Multimedia (MULTIMEDIA '04). ACM, New York, NY, USA
- [10] Furi Sawaki, Kentaro Yasu, and Masahiko Inami. 2012. flona: development of an interface that implements lifelike behaviors to a plant. In Proceedings of the 9th international conference on Advances in Computer Entertainment (ACE'12), Anton Nijholt, Teresa Romão, and Dennis Reidsma (Eds.). Springer-Verlag, Berlin, Heidelberg, 557-560.
- [11] Timm-Oliver Wilks, Thorsten Kiesl, and Harald Moser. 2007. The Garden Eden